 |
|
|
|
|
|
|
|
|
|
3D-Chemical Dynamics ; Photoelectron/photoion Imaging
1. Introduction Photoionization and photodissociation dynamics are studied using the imaging technique for developing a complete understanding of a physical or chemical event, being it photoionization, photolysis, or the chemical reaction of a given molecule. When molecule is dissociated and ionized by external energy source, momentum and total energy of fragments (ion/electron or neutral) conserve. Related information of this is revealed to released kinetic energy and angular distribution of fragment. The energy and angular distribution of photoelectron or fragment ions can be simultaneously determined in this technique. The information let us know character of excited state dynamics of any species. Especially, fragmentation from cations or photoionization of radicals are going to be studied. VUV-ionization will be applied for the detection of photoelectrons from nano or biological materials.
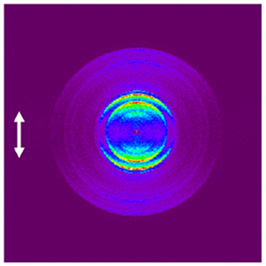
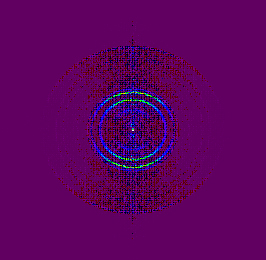
2. Schematic method Charged fragments, which is photoelectron or selective ionization of neutral fragment via REMPI technique on the electric field. Then, cylindrically symmetric bundle of fragments, which is called ‘Newton sphere’, is pressed like a disk and then pushed to PSD (Position Sensitive Detector) by external electric field. After arriving at PSD, generated ions/photoelectrons yield image per each event. Sequential steps are then performed as image recording by CCD camera, and applying inverse Abel transform or BASEX, which is the one of numerical transform tool, for the obtain restored ‘Newton sphere’. For example, bellow image is Oxygen ion dissociated from molecular oxygen. Raw images of left O+ and reconstructed image of right in the photodissociation of O2 at 225 nm.
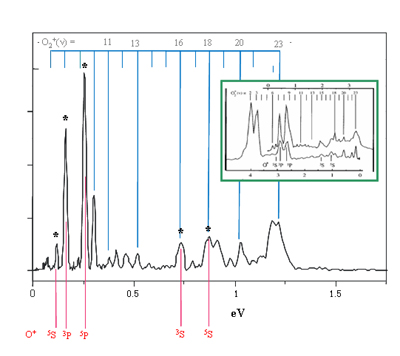
Corresponding 3-dimensional images of O+ constructed by the BASEX algorithm.33 In the image, the pump laser was linearly polarized and the plane of polarization was vertical to the time-of-flight axis as shown by a vertical arrow. Each peak of bellow kinetic energy plot of dissociated oxygen represent the vibration level of excited state of molecular oxygen and electronic state of formed atomic oxygen.
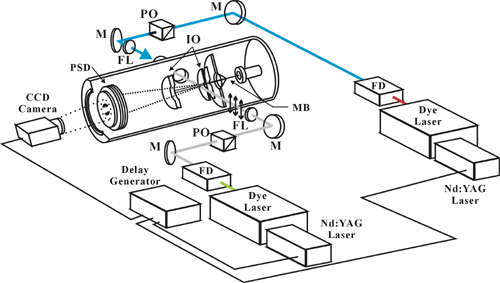
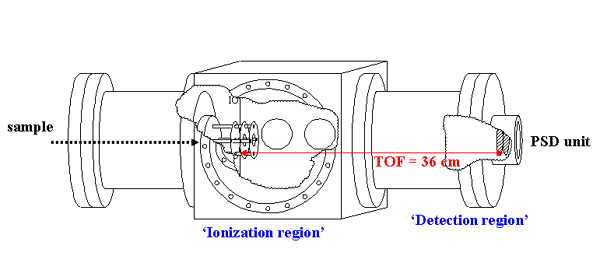
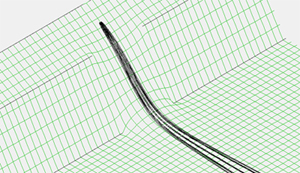
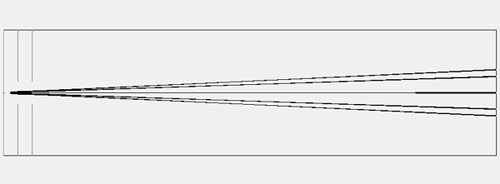
3. Experimental detail Our velocity mapping apparatus consists of a supersonic molecular beam source, a time of flight (TOF) mass spectrometer, a position sensitive detector, photon sources, and overall system control units. A differentially pumped vacuum chamber was equipped with two turbomolecular pumps. A supersonic jet of the molecule was generated through a nozzle into vacuum. Before mixing, all of them, which are liquid at room temperature, are in the custody of sample room. The internally ‘hot’ sample molecules transfer some of internal energy to ‘buffering’ He molecules through collisions between them. The molecular beam was then skimmed at a 1 mm diameter skimmer, which is far from the nozzle mouth about 10 cm, before entering the ionization chamber. Perpendicular velocity component to propagation direction is removed by the skimmer. Then very fast (~1000 m/s) molecular beam is forced to have no rotational and vibrational internal energy but trasnslational energy. The lack of rotational and vibrational internal energy gives the driving force of molecular cooling system. The external triggered home-made nozzle driver controls width and delay of well-prepared molecular beam. Third harmonic output (355 nm) of a pulsed Nd:YAG laser was used to pump a dye laser to generate wavelength tunable laser pulse. The same laser pulse was also used for pumping the parent molecule. The laser polarization was usually set to be vertical to the detection axis which is defined along the time-of-flight path. A half-lambda wave plate and polarizer were used for the manipulation of the laser polarization. The laser was focused onto the center of the molecular beam through a plano-convex lens with a nominal focal length of 150 mm. Ions generated by the laser irradiation were repelled, accelerated, drifted along the field-free region, and detected on the PSD equipped with dual microchannel plates (MCP 40 mm) coupled with a phosphor screen (P20). The length of TOF tube from ionization position to PSD is 36 cm. In specific ratio of potential repelling and accelerating plate of our composition, VE/VR ≈ 0.773, mapping potential contour takes shape well. Ion optics was assembled according to the design of Eppink and Parker so that ion fragments with the same kinetic energy, regardless of their initial positions, can be mapped into the same position of the detector. Static electric fields on ion optics were carefully adjusted to attain the velocity mapping condition. Bellow picture is ion trajectory simulation. Static electric field looks like a slide. For considering angular distribution, ions , of which angle to flight axis is same, are ‘mapped’ on same position
A specific mass signal was selected by gating the front MCP plate using a fast high-voltage pulser which gave the pulse of -500 V with a time duration of ~60 ns. The ion images were observed through a charge-coupled-device (CCD) camera with binned 500500 pixels using the center-of-gravity event-counting method. Raw Images were reconstructed using the basis set expansion (BASEX) algorithm33 to obtain three dimensional distributions of photofragments.
|


